[[getLangText('background')]]
Random forest algorithm for identifying mild cognitive impairment in patients with type 2 diabetes
Disclaimer: This predictive model was trained on retrospective single - center data and lacks external validation. It is intended solely for research use to support scientific exploration by qualified personnel. It must not be utilized for clinical decision - making. External validation is encouraged to evaluate its generalizability.
[[getLangText('parameter_description')]]
CDR1as:Relative expression levels of CDR1as in plasma(2-△△Ct)
α-Syn:The level of α-Syn in plasma(ng/dL)
HCY:The level of HCY in plasma(μmol/L)
hsCRP:The level of hsCRP in plasma(mg/L)
UACR:UACR in urine
HbA1c:glycosylated hemoglobin (%)
diabetes duration: (year)
years of education: (year)
female:
age: (year)
CDR1as:cerebellar degeneration-related protein 1 antisense transcripts
α-Syn:α-Synuclein(ng/dL)
HCY:homocysteine(μmol/L)
hsCRP:high-sensitivity C-reactive protein(mg/L)
UACR:urinary albumin-to-creatinine ratio
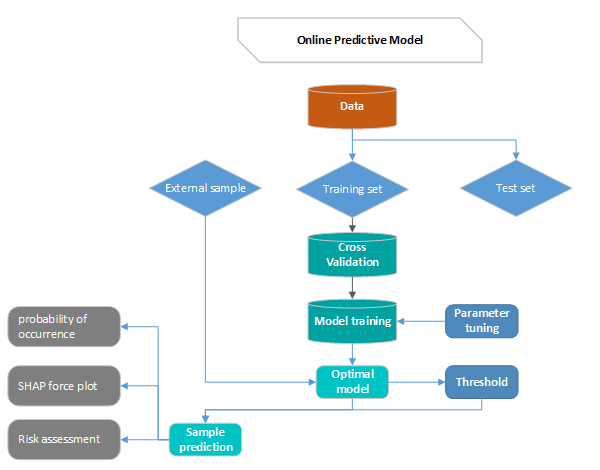
Principle:
First divide the data into training set and test set, then use the cross-validation method to train the model in the training set, train the optimal model as the final model and record the threshold at this time as the final threshold, and finally observe the model in the test performance on the set. By continuously adjusting the parameters of the model, the generalization ability of the model is improved, and the performance of the model in the training set, validation set and test set is relatively optimal.
By the predicted sample into the optimal model, the model will predict the probability of occurrence, generate the SHAP force plot, and then evaluate the risk according to the predicted probability and prediction.