
Development of a Web-Based Model for Predicting Cervical Lymph Node Metastasis in caDTC Using Machine Learning Algorithms
Background
Thyroid carcinoma (TC) is the most common endocrine system malignancy, and its incidence is increasing worldwide. Among them, differentiated thyroid carcinoma (DTC) is the most common subtype of TC, which includes papillary thyroid carcinoma (PTC) and follicular thyroid carcinoma (FTC), accounting for the vast majority of thyroid malignancies. DTC is relatively uncommon in children and adolescents, but its incidence has also been increasing in recent years. The clinical manifestations and prognosis of DTC in children and adolescents (caDTC) differ from those in adults. Therefore, a treatment model that works for adults may not work for children or adolescents. Despite the favorable long-term prognosis of caDTC, the risk of death increases significantly once lymph node metastasis (LNM) occurs. The current methods for evaluating preoperative lymph node status mainly include ultrasonography (US) and invasive fine-needle aspiration (FNA), but their sensitivity is limited. There is currently a lack of more accurate methods to identify the risk of CLNM. Therefore, it is necessary to develop new diagnostic tools to predict the status of cervical lymph nodes. Machine learning (ML) is a new computer-based data analysis method that has been widely used in clinical medicine. By learning from dataset patterns, ML can discover more interactions between variables and outcomes with better accuracy than traditional statistical methods. Since few studies have established caDTC-based lymph node metastasis prediction models. This study aimed to construct a network visualization online computing model based on the XGBoost algorithm to identify the relevant risk factors for CLNM in caDTC patients.
Parameter Description
Median household income: 0: 35,000-54,999$; 1: 55,000-64,999$; 2: 65,000-74,999$; 3: ≥75,000$;
Multifocality: 0: Solitary tumor; 1: Multifocal tumor; 2: Unknown;
Region: 0: Pacific Coast; 1: East; 2: Northern Plains; 3: Southwest;
Tumor size: 0: ≤1cm, 1: 1-2cm, 2: 2-4cm, 3:>4cm;
Extrathyroidal extension: 0: Intrathyroidal extension or minimal extrathyroidal extension; 1: Gross extrathyroidal extension;
Histological type: 0: Papillary thyroid carcinoma; 1: Follicular thyroid carcinoma;
Race: 0: White; 1: Black; 2: Other (American Indian, Alaska Native, Asian or Pacific Islander);
Age: 0: ≤10; 1: 11-18
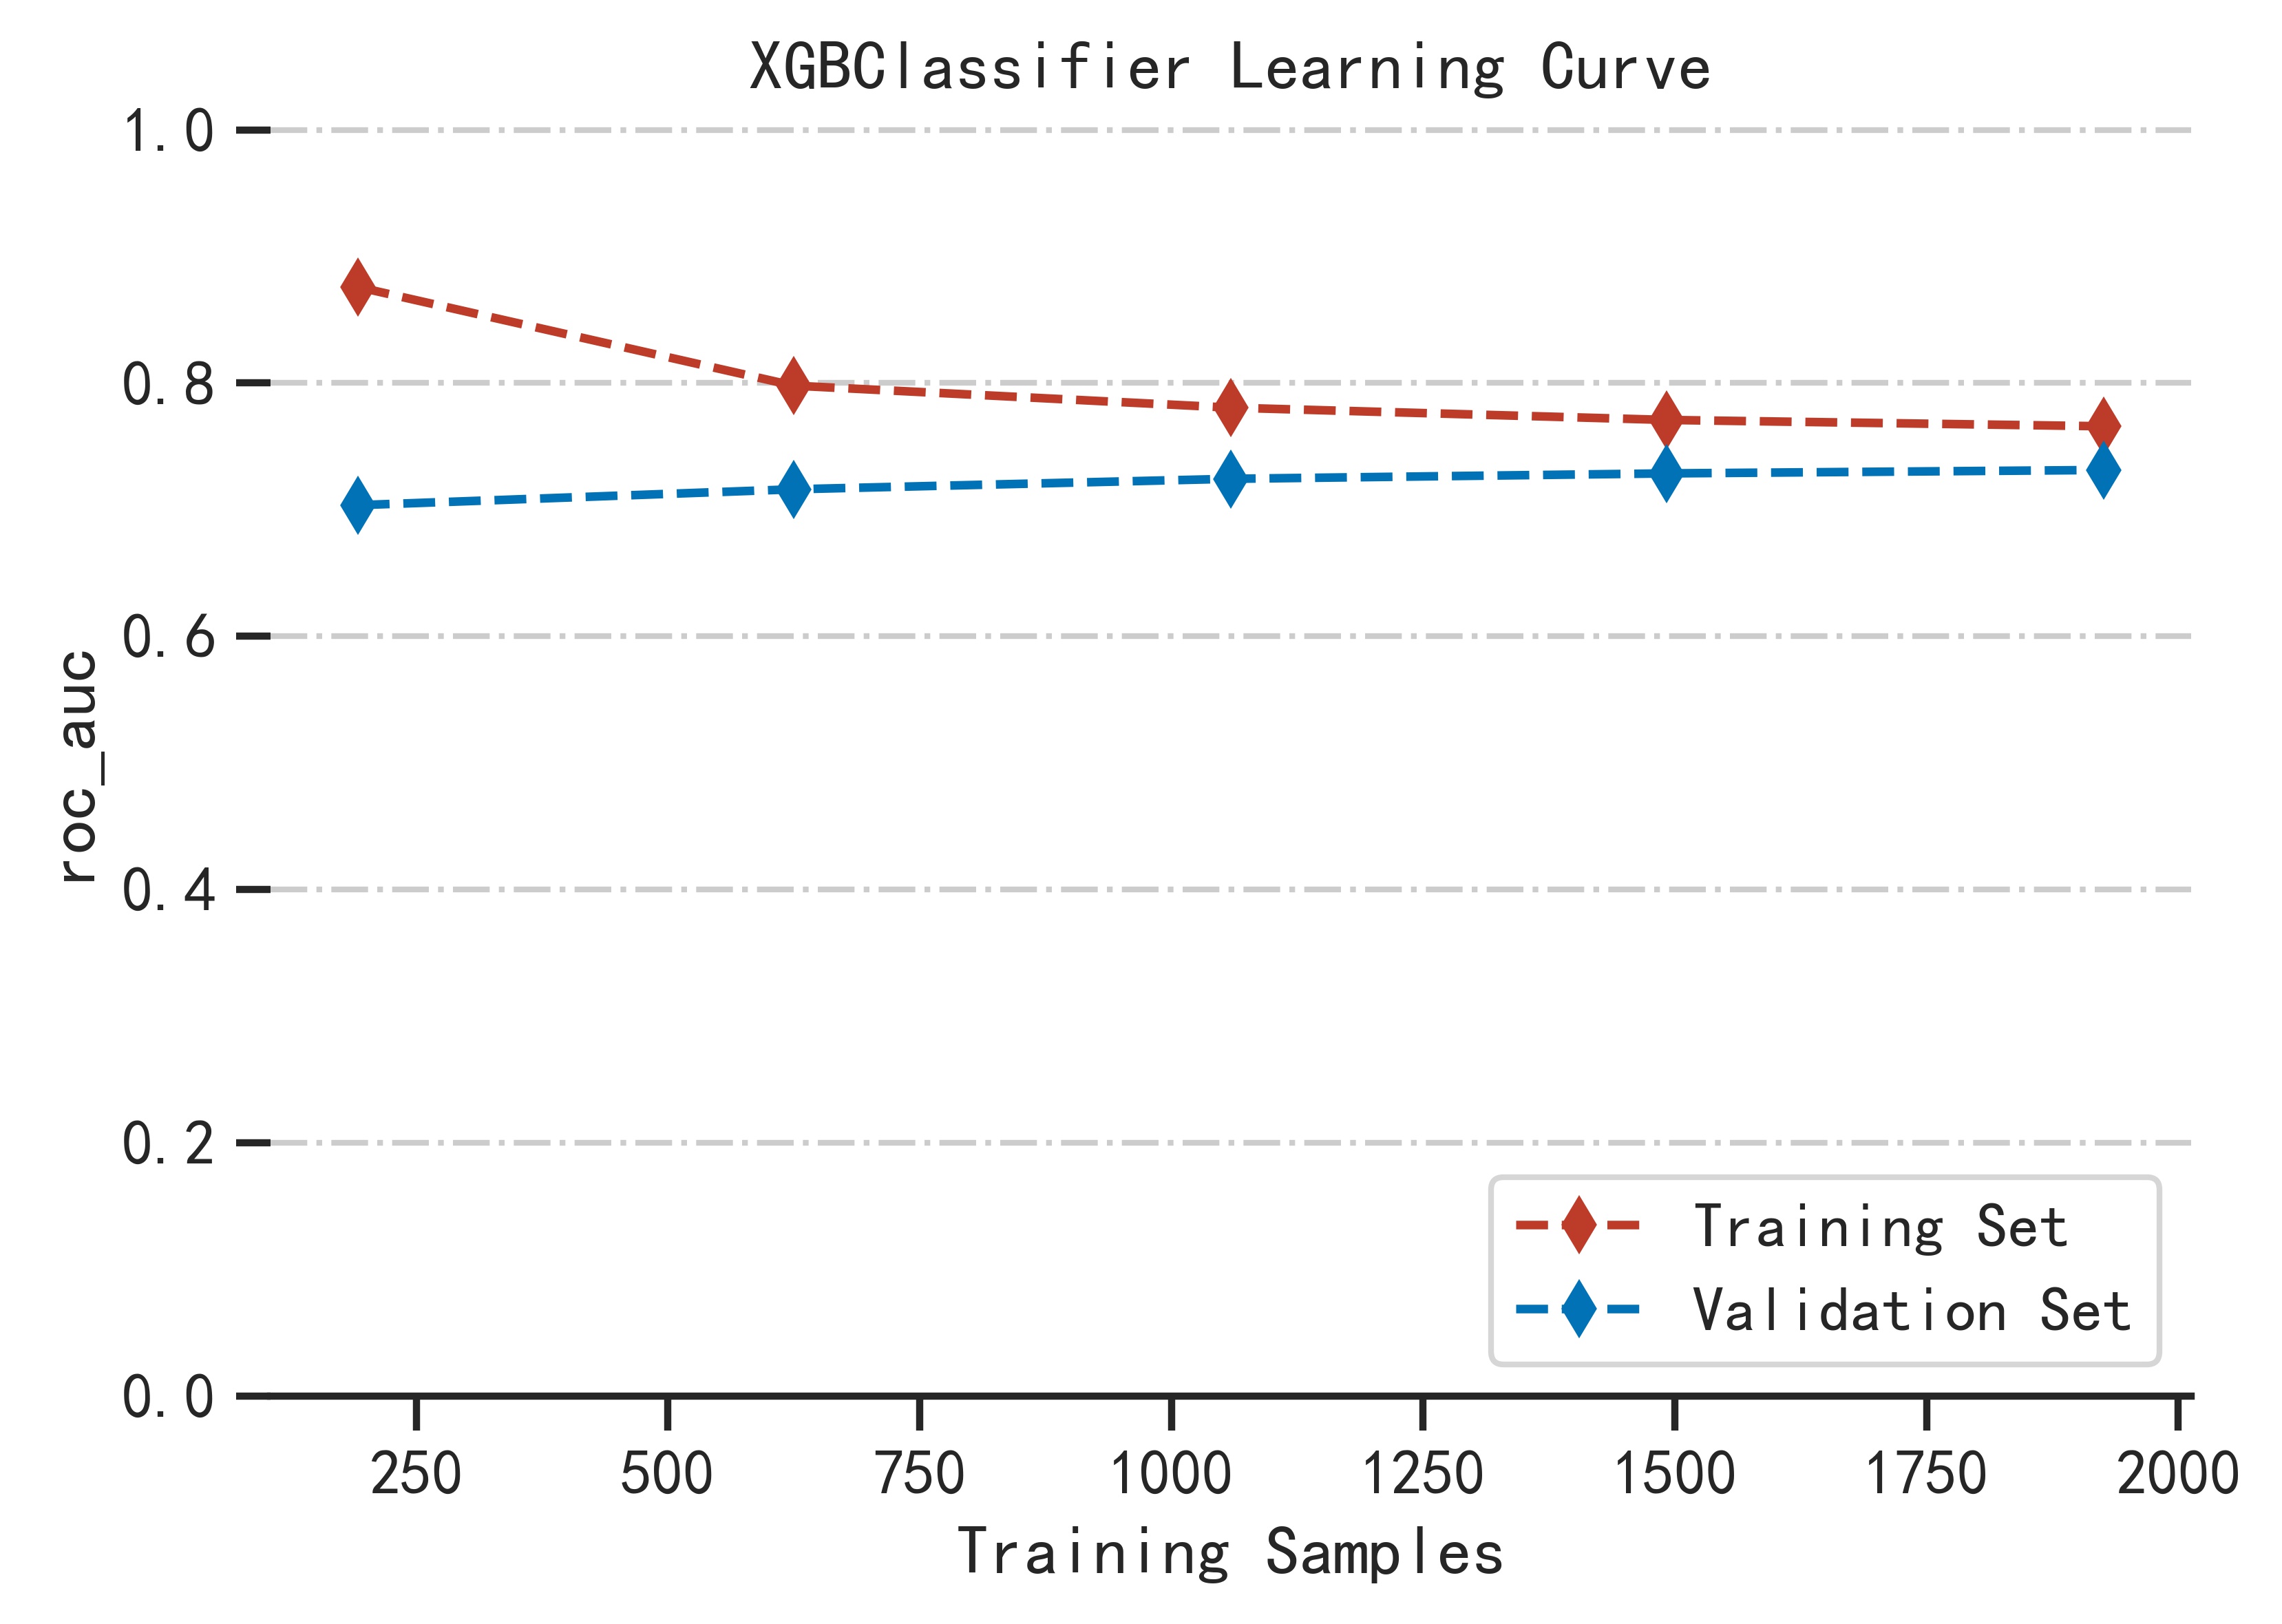
1.Model introduction:
XGboost (extreme Gradient Boosting) is an
improved algorithm based on the GDBT (Gradient Boosting Decision Tree) algorithm. Traditional
GDBT Model uses only the first derivative in the optimization, but XGBoost preforms the
second-order Taylor expansion of the cost function and adds a regularization item into the cost
function for better performance.As an integrated learning algorithm, it combines the predictions
from an ensemble of weak regression trees, which are added sequentially to the model in order to
maximize predictive performance and minimize model complexity. At the same time, XGboost adds a
complexity control model and learns from random forests to reduce the calculation, making the
model not easy to over-fitting. With above characteristics, XGboost has been draw more attention
for prediction model constructing and risk identification in medical field .
2.Samples:
A total of 2519 patients with differentiated thyroid cancer (DTC) aged≤18 years were included in this study. There were 445 male subjects and 2074 female subjects, and a total of 1279 patients with cervical lymph node metastasis (CLNM). We randomly selected 15% of the data in the total sample as the test set (N=377).
3.Method:
All analyses were completed based on python version 3.7.Where the python version package of the XGBoost model is xgboost 1.2.1.
4.Model parameters:
objective:binary:logistic;
learning_rate:0.3;
max_depth:2;
min_child_weight:1;
reg_lambda:1
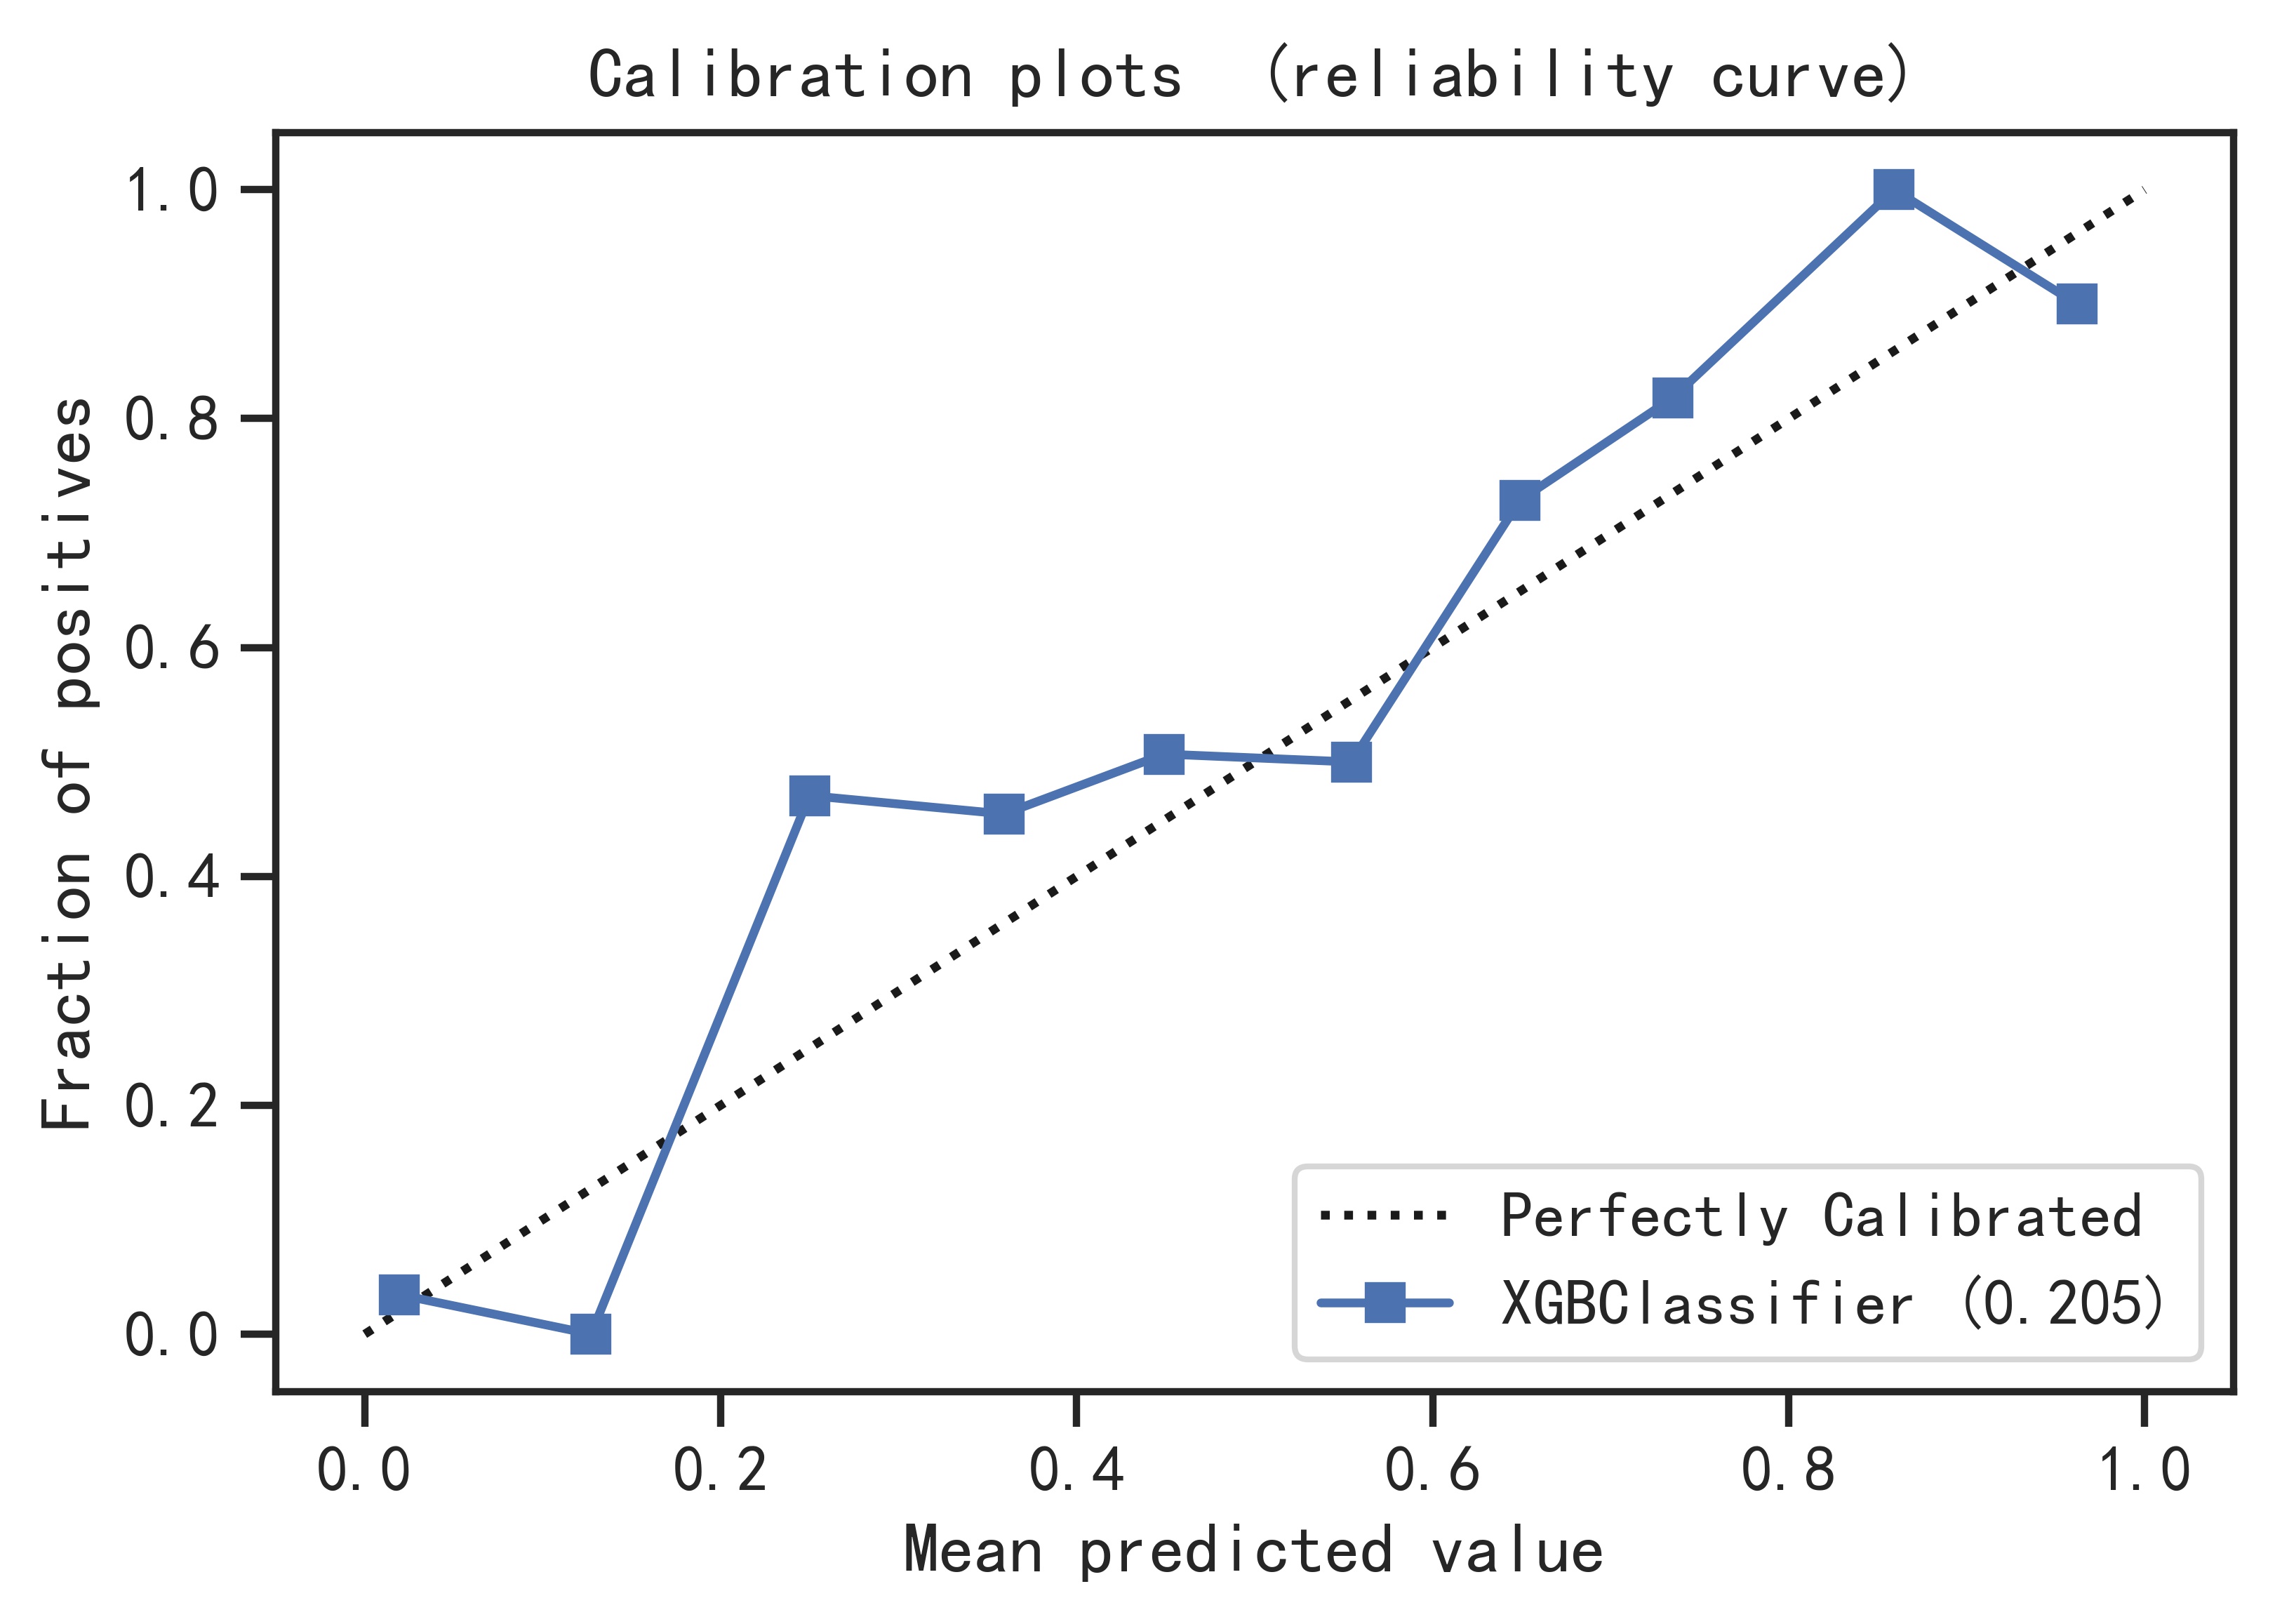
5.Model performance:
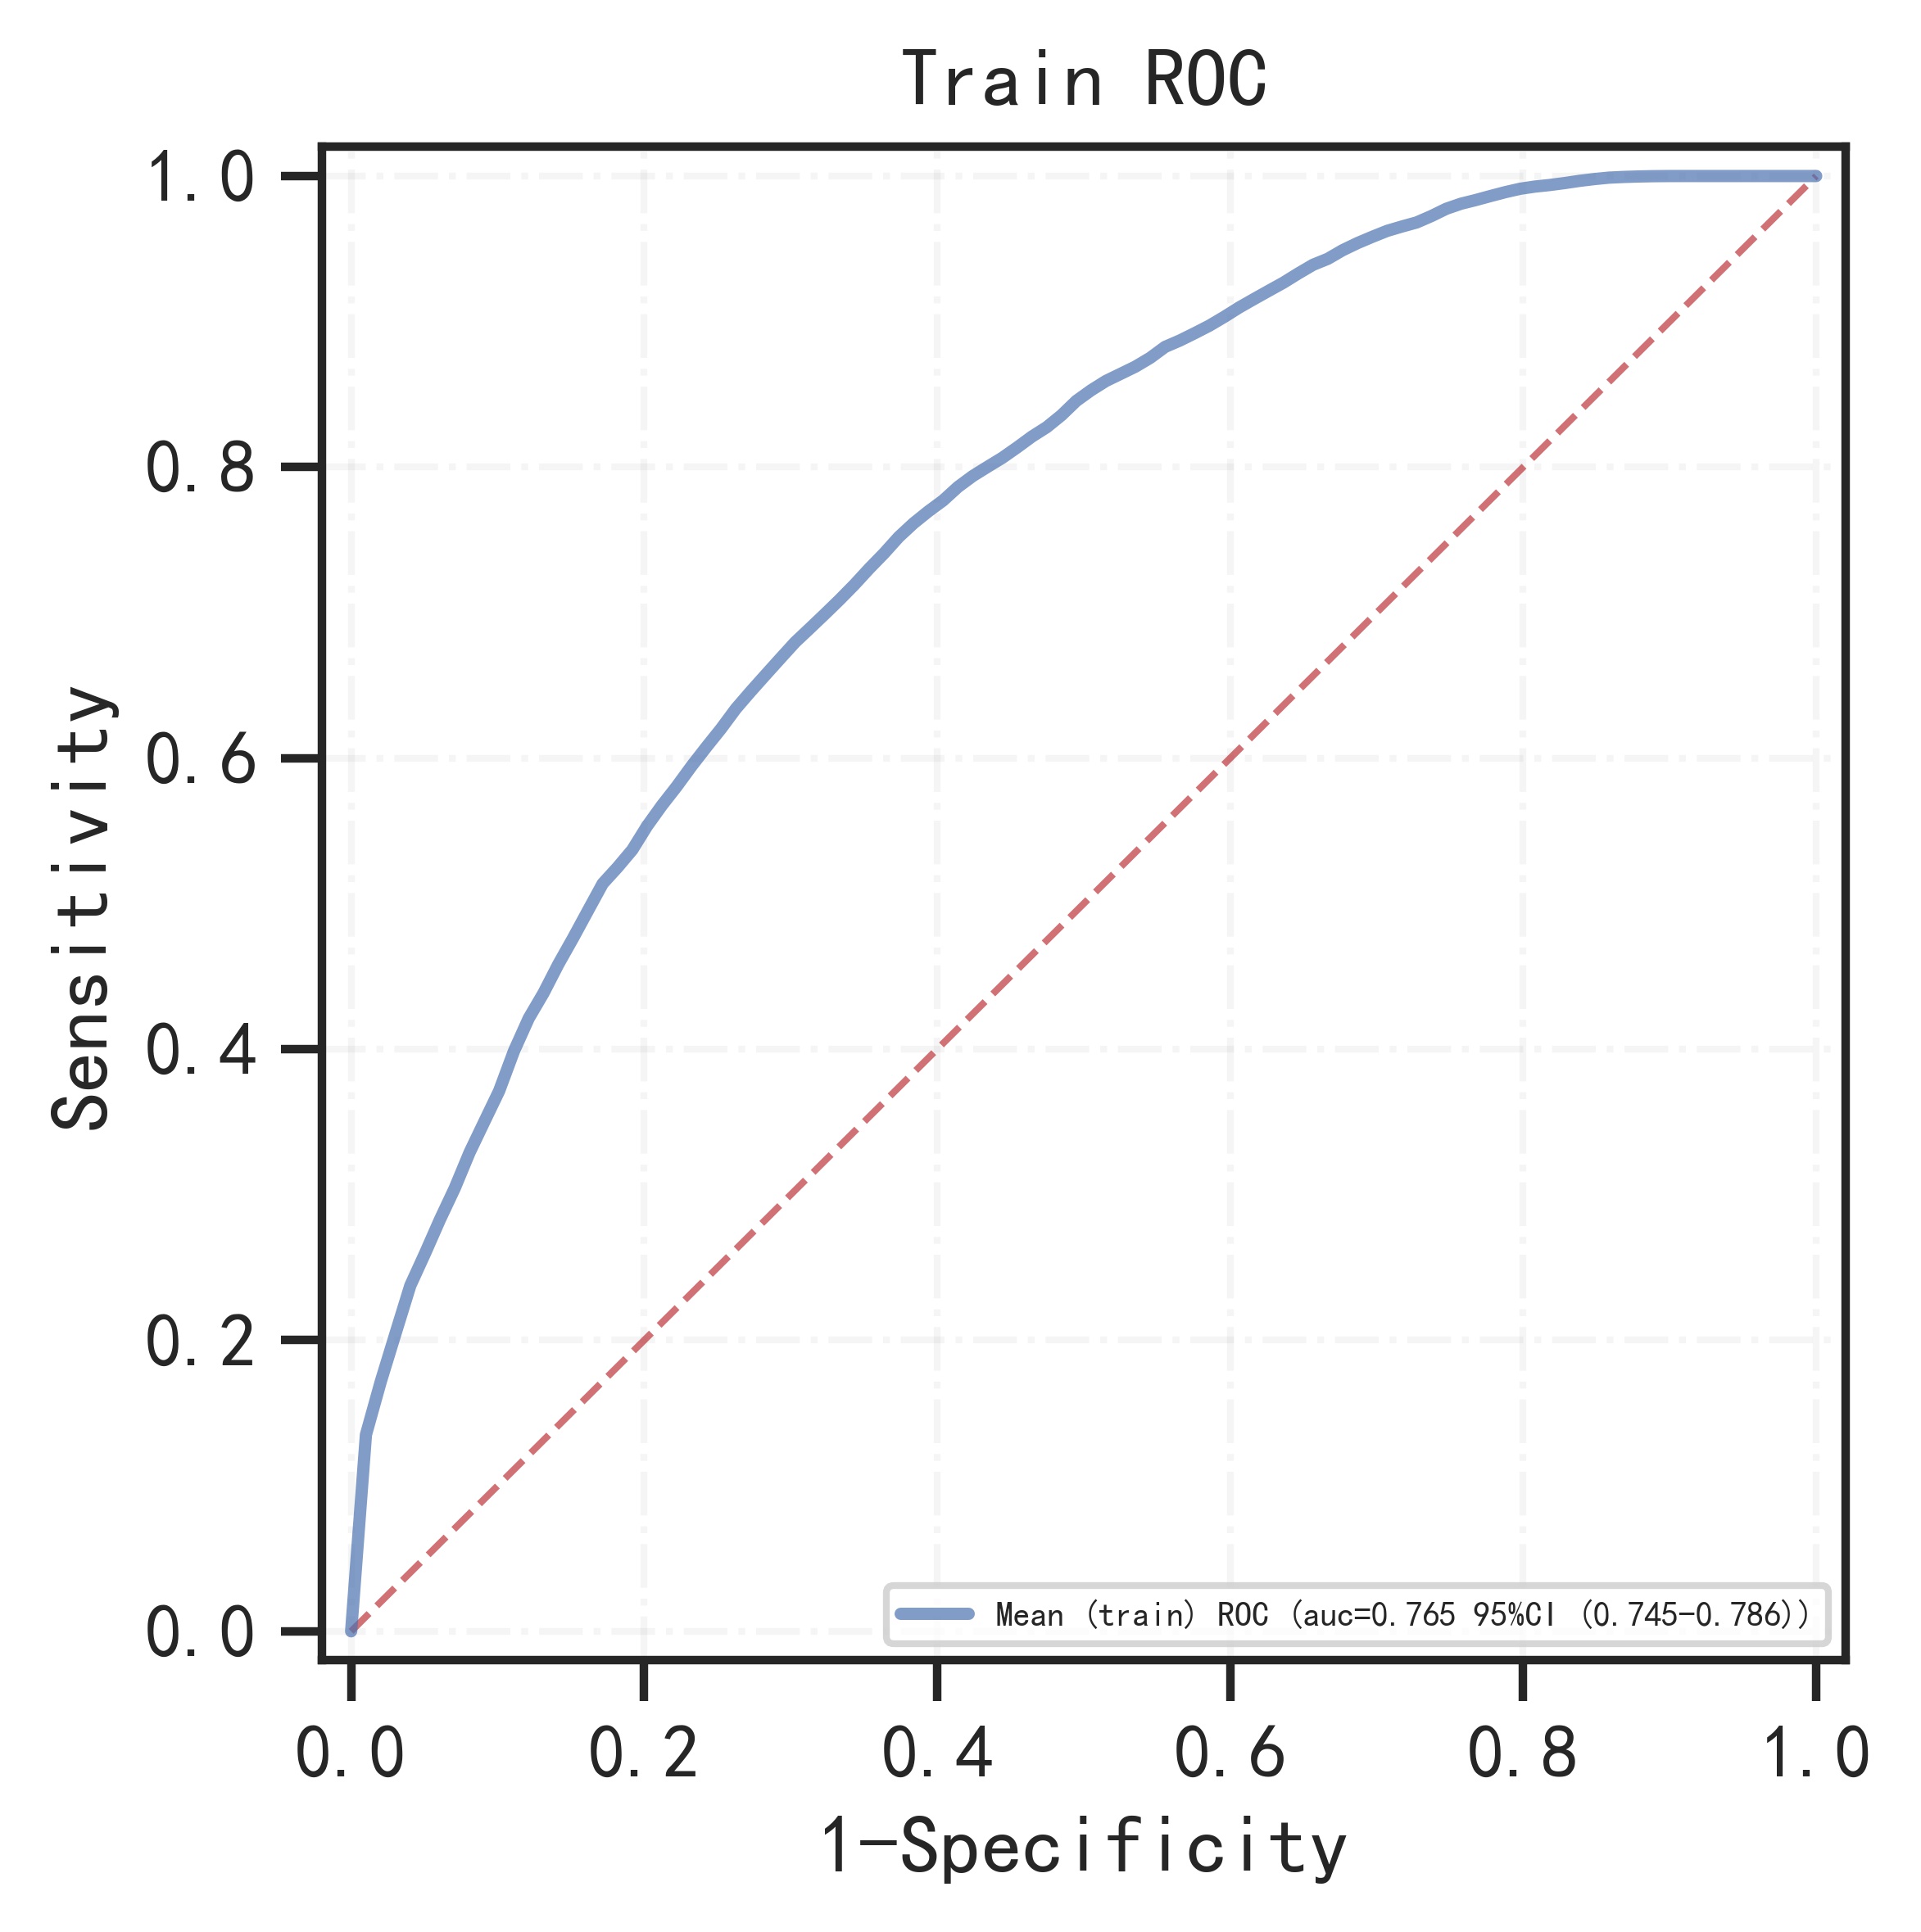
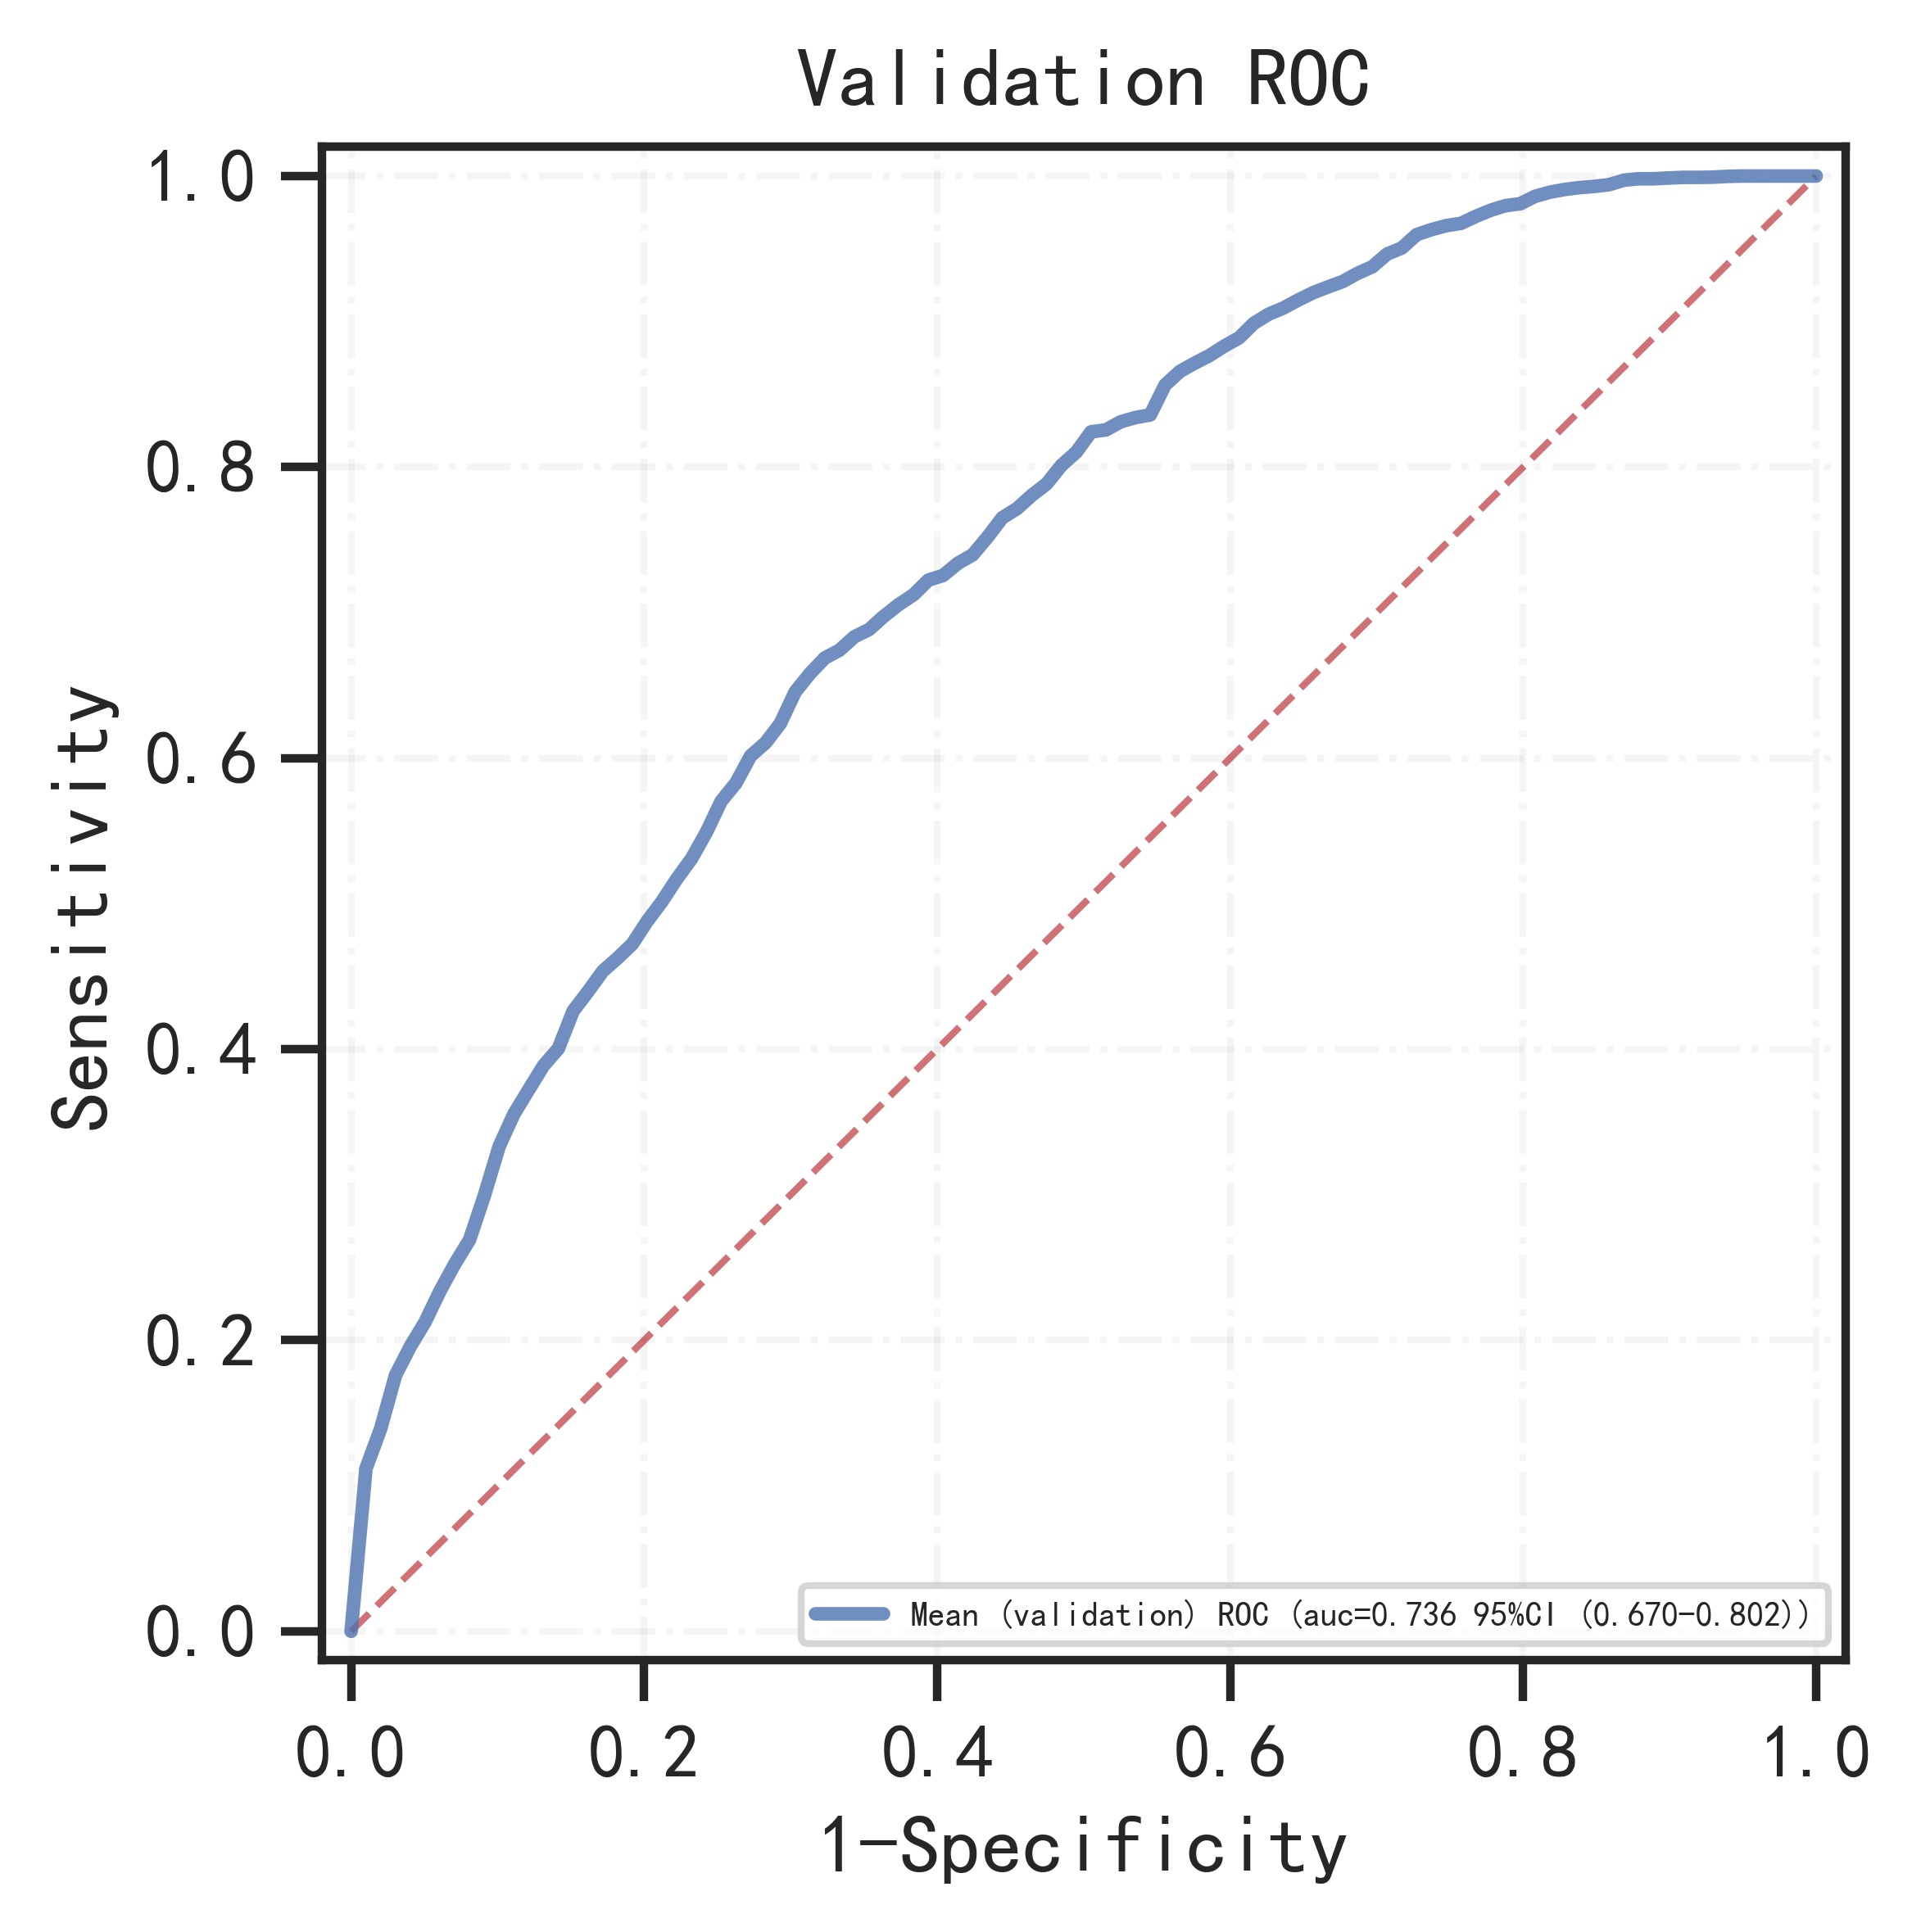
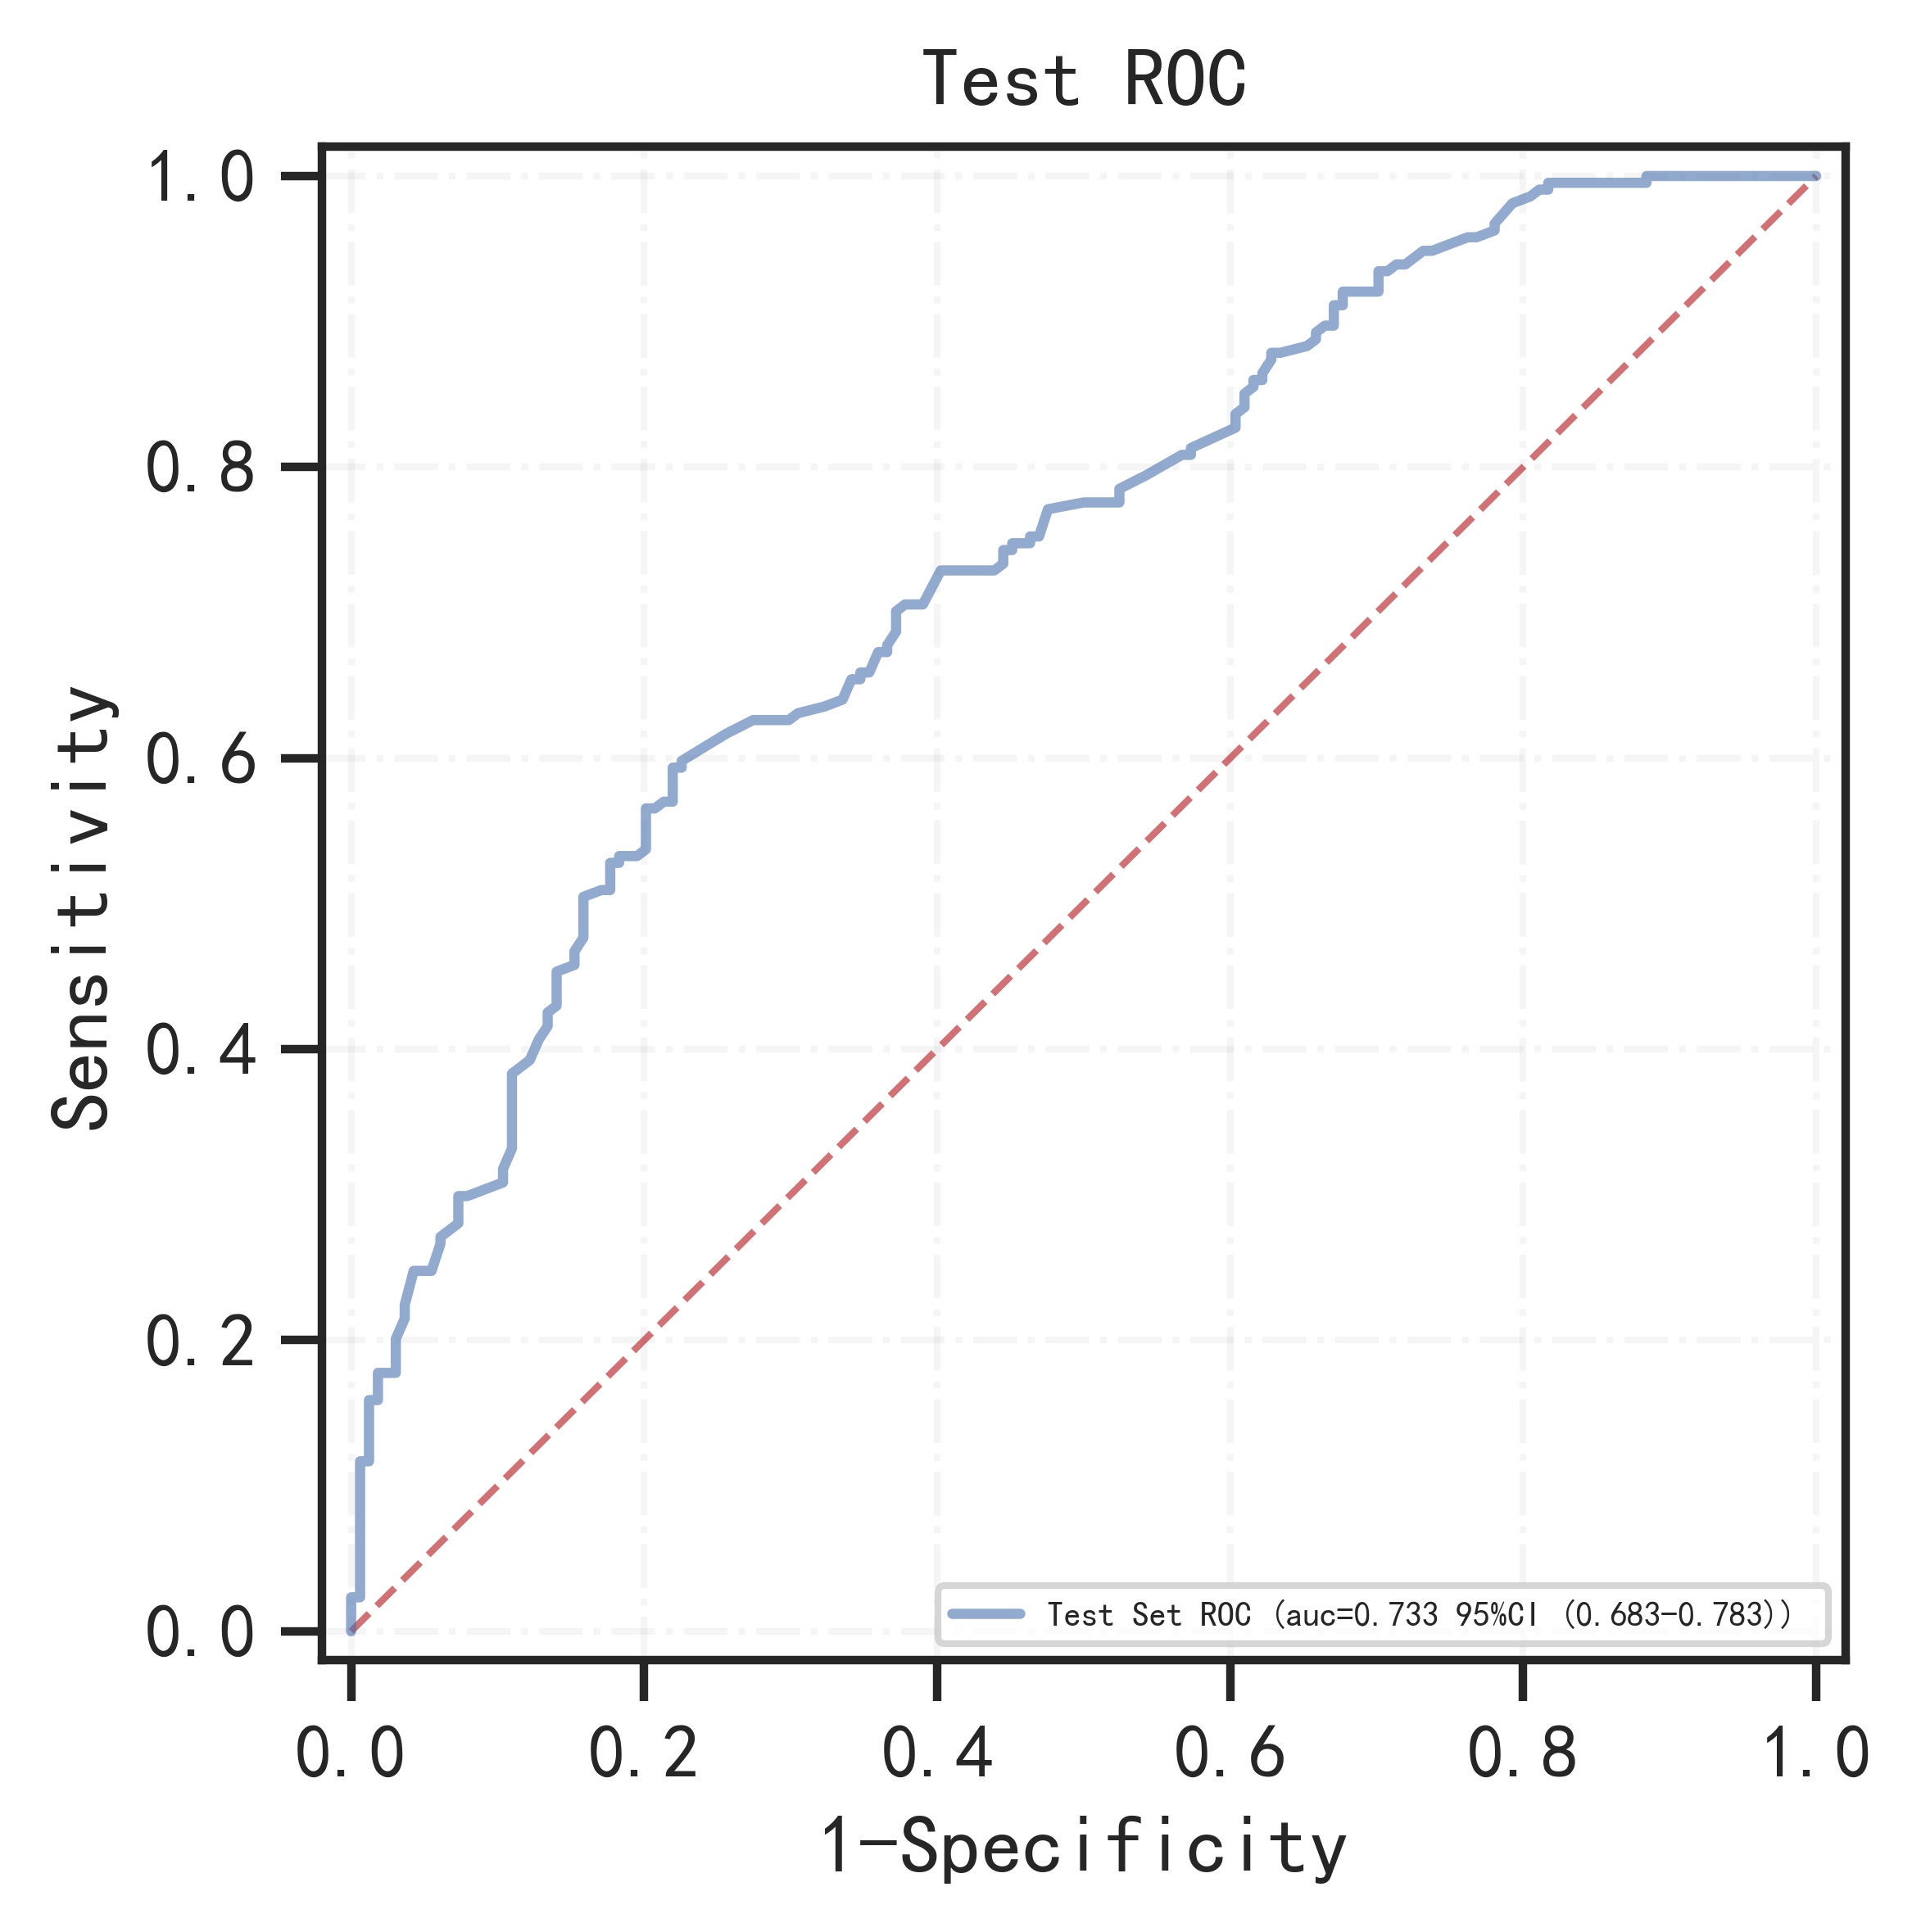
The remaining samples were used as training set and validation set for 10-fold cross-validation. The model has AUC=0.766 (95%CI: 0.745-0.786) in the training set, AUC=0.736 (95%CI: 0.670-0.802) in the validation set, and AUC=0.733 (95%CI: 0.683-0.783) in the test set.
Training set:
| AUROC (95%CI) |
Accuracy (95%CI) |
Sensitivity (95%CI) |
Specificity (95%CI) |
PPV (95%CI) |
NPV (95%CI) |
F1-score (95%CI) |
| 0.766 (0.745-0.786) |
0.691 (0.689-0.694) |
0.726 (0.696-0.756) |
0.658 (0.629-0.687) |
0.679 (0.669-0.689) |
0.708 (0.695-0.722) |
0.701 (0.691-0.710) |
Validation set:
| AUROC (95%CI) |
Accuracy (95%CI) |
Sensitivity (95%CI) |
Specificity (95%CI) |
PPV (95%CI) |
NPV (95%CI) |
F1-score (95%CI) |
| 0.736 (0.670-0.802) |
0.660 (0.646-0.675) |
0.738 (0.677-0.799) |
0.640 (0.572-0.709) |
0.650 (0.635-0.664) |
0.677 (0.656-0.698) |
0.688 (0.661-0.715) |
Test set:
| AUROC (95%CI) |
Accuracy | Sensitivity | Specificity | PPV | NPV | F1-score |
| 0.733 (0.683-0.783) |
0.669 | 0.593 | 0.780 | 0.711 | 0.617 | 0.647 |
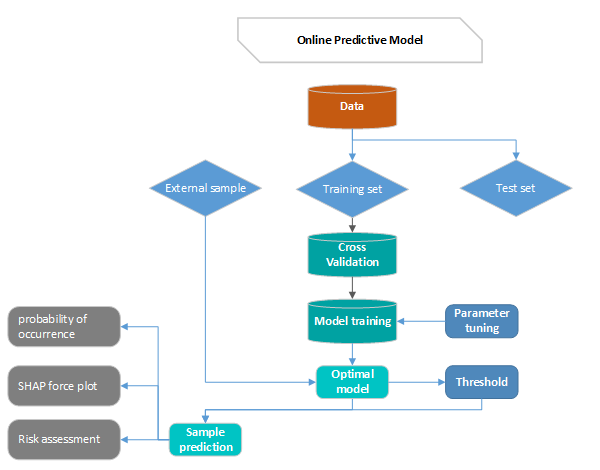
Principle:
First divide the data into training set and test set, then use the cross-validation method to train the model in the training set, train the optimal model as the final model and record the threshold at this time as the final threshold, and finally observe the model in the test performance on the set. By continuously adjusting the parameters of the model, the generalization ability of the model is improved, and the performance of the model in the training set, validation set and test set is relatively optimal.
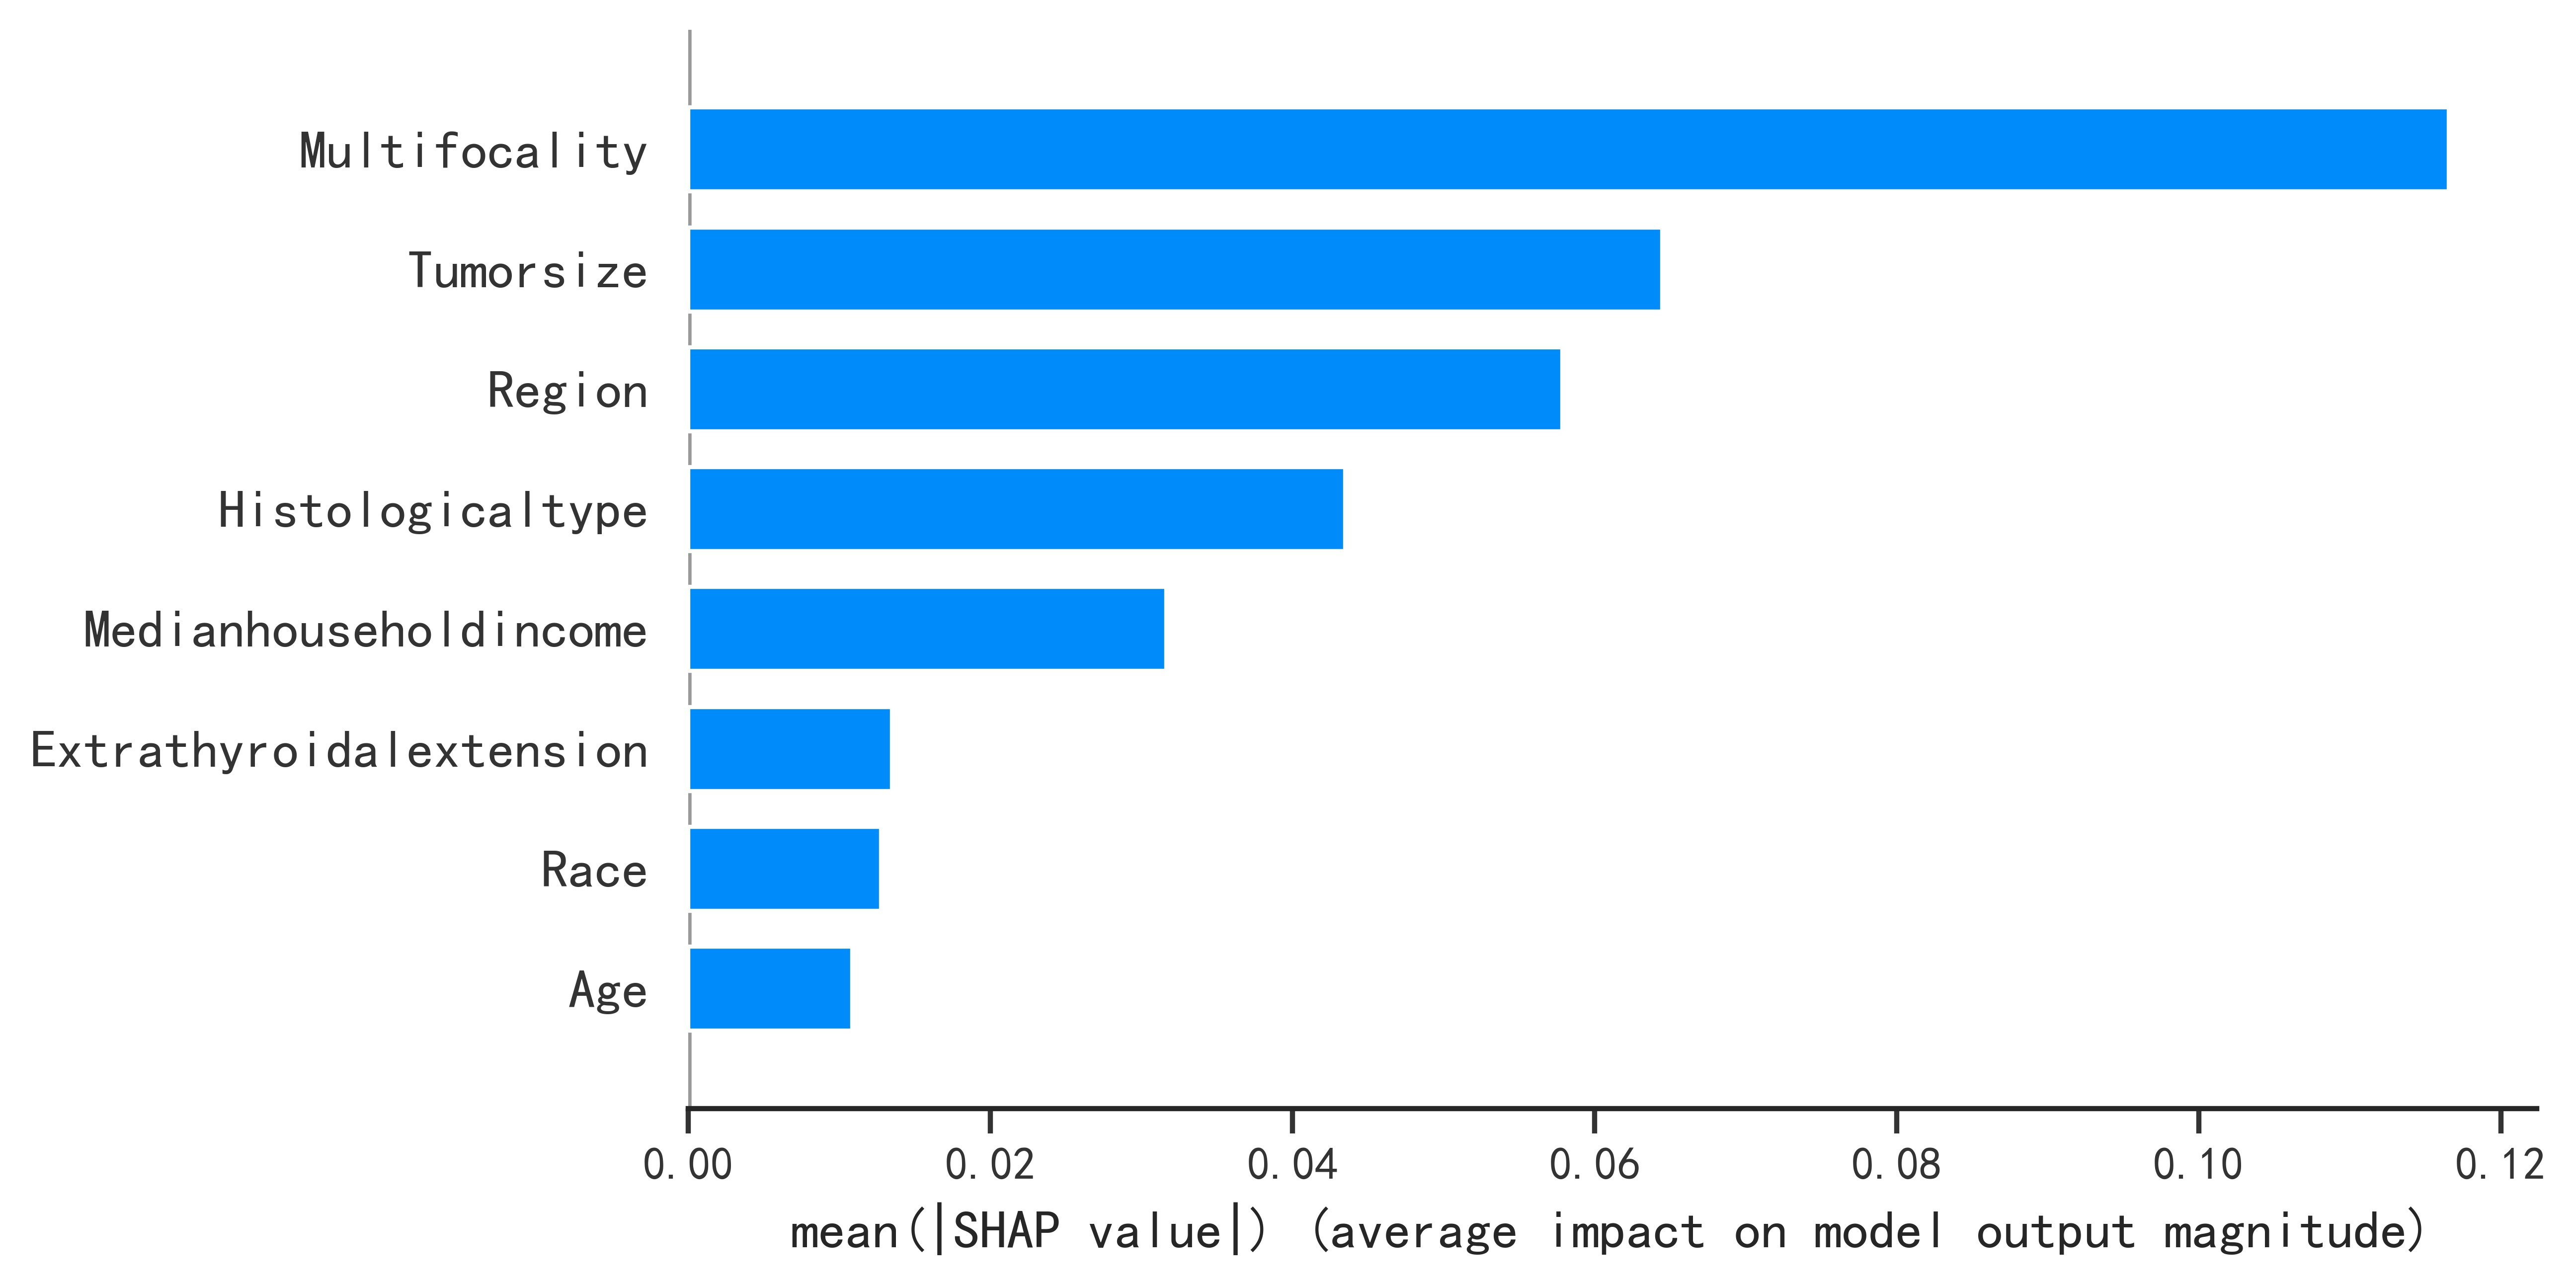
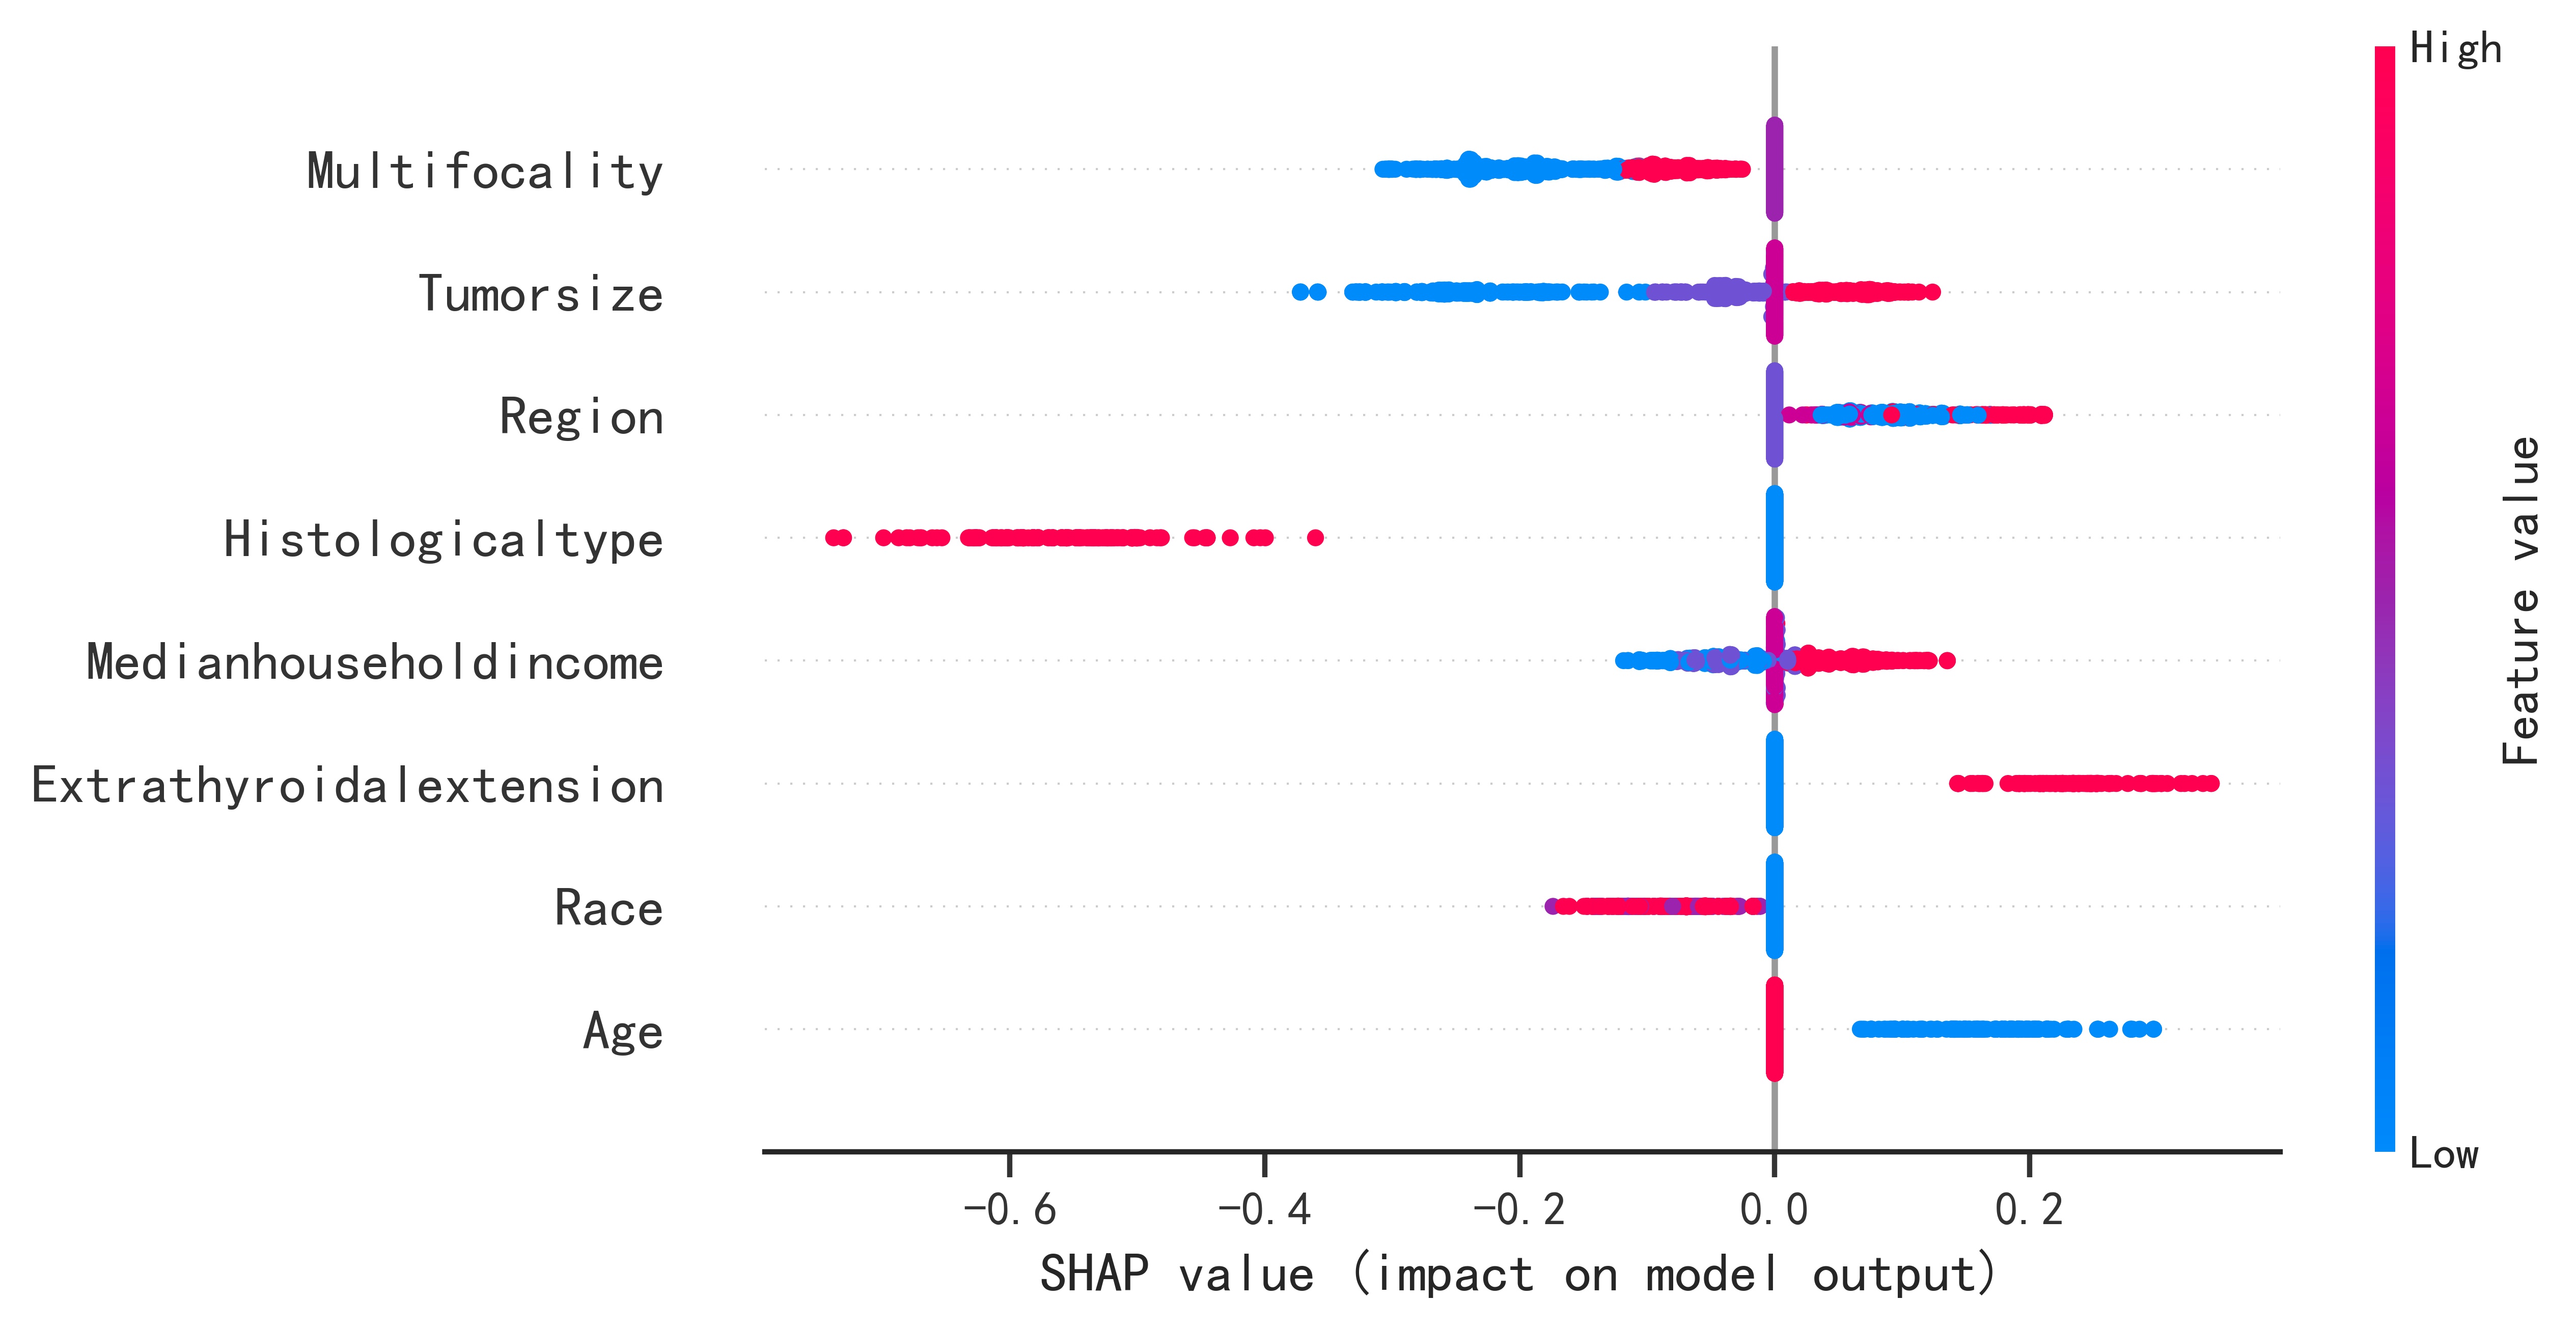
By the predicted sample into the optimal model, the model will predict the probability of occurrence, generate the SHAP force plot, and then evaluate the risk according to the predicted probability and prediction.